Smart assistant for your business
FinPlan is a management reporting service that helps to make management decisions quickly and increases profitability of the business.
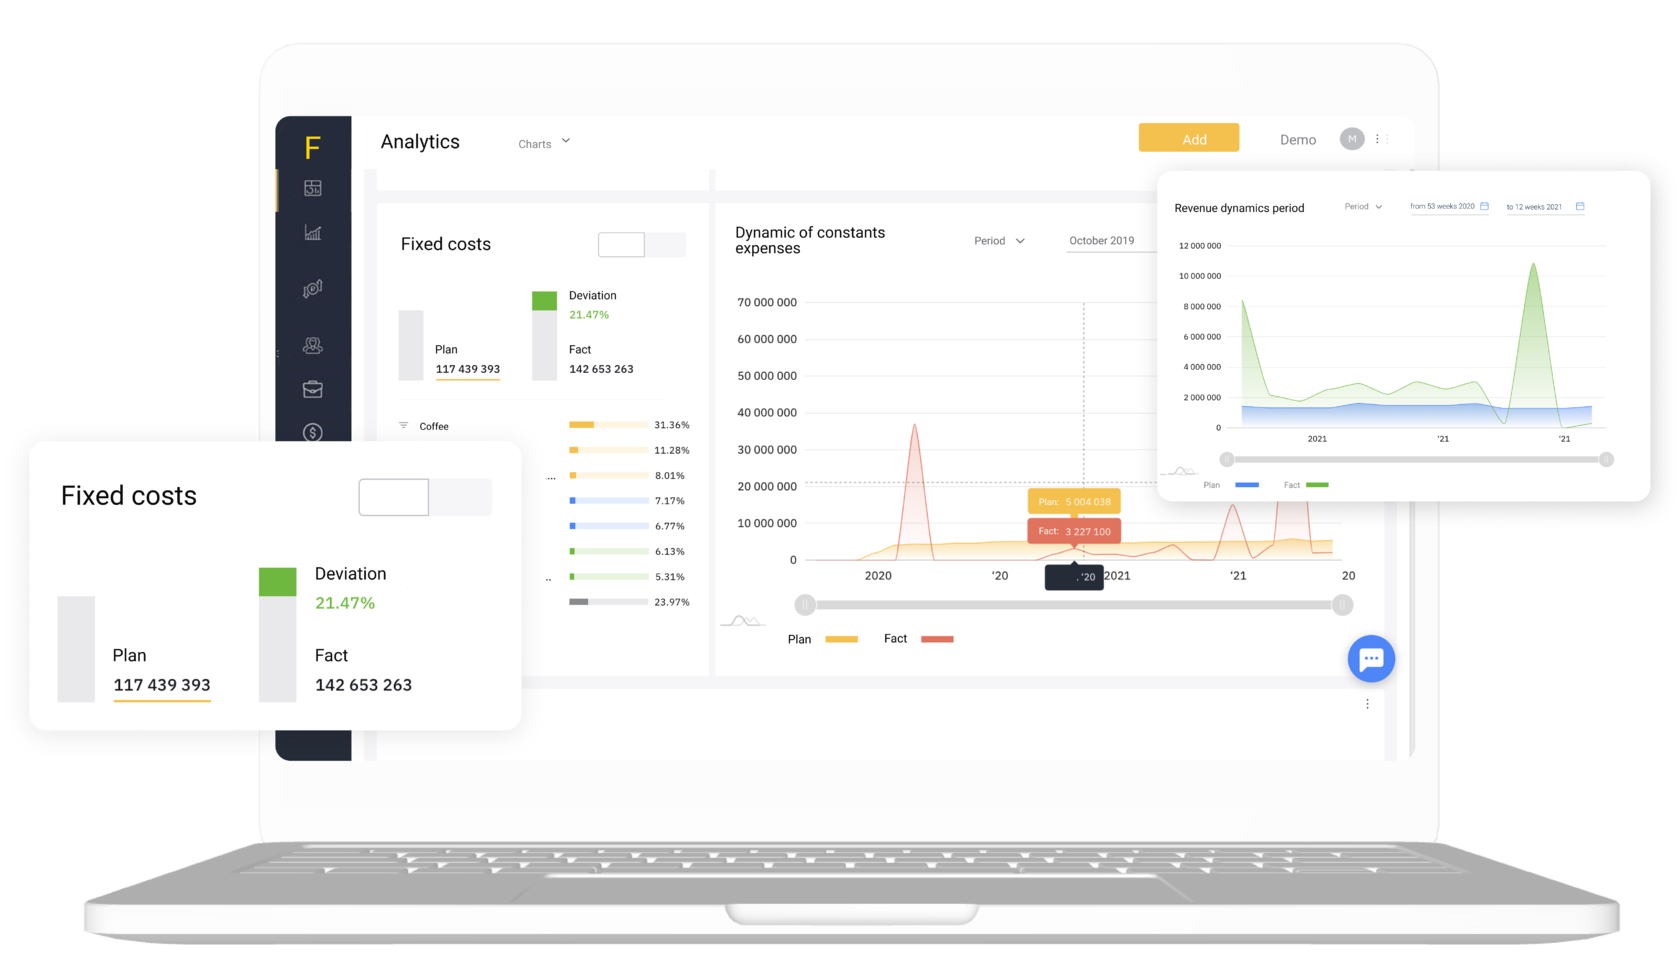


Drill-down up to the documents

Vertical analysis


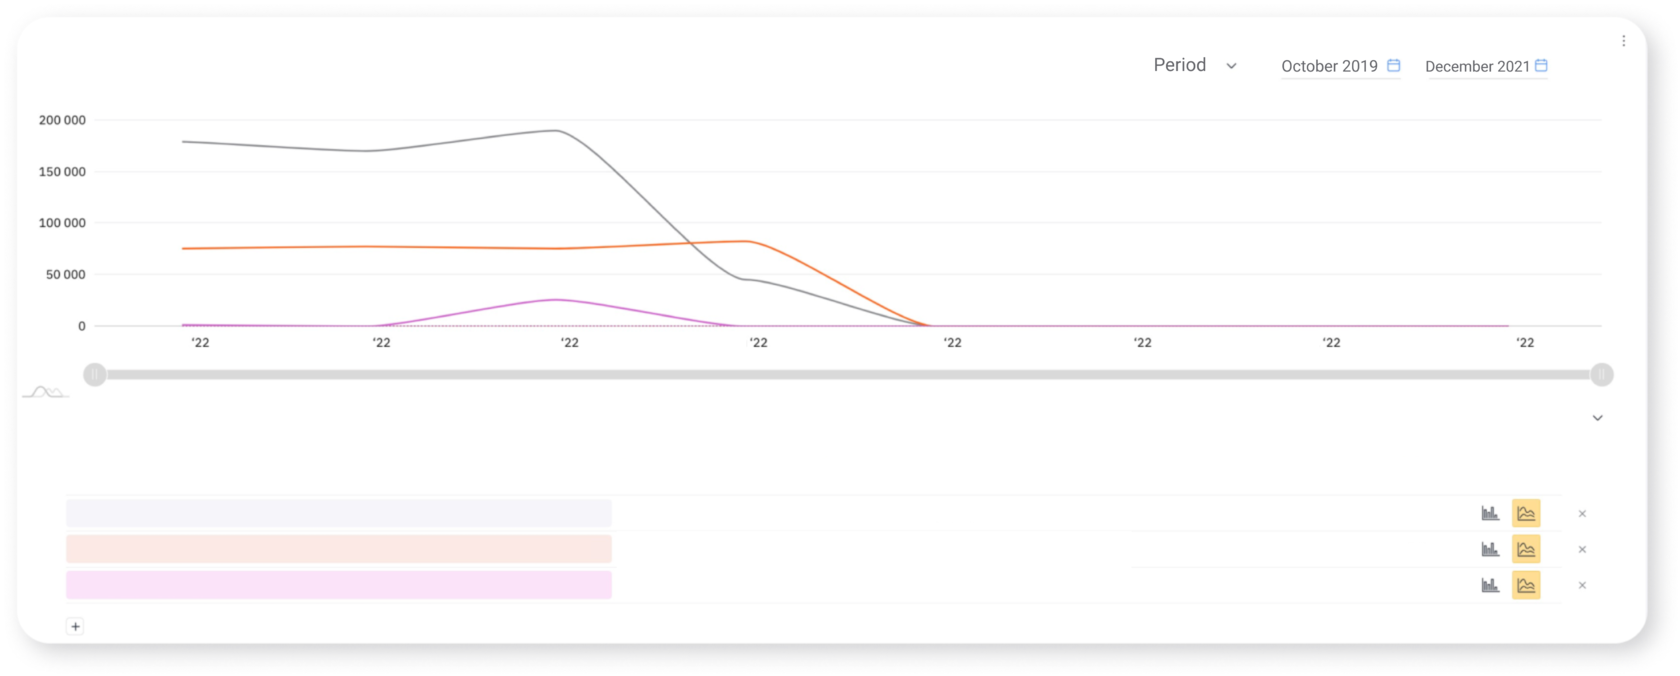


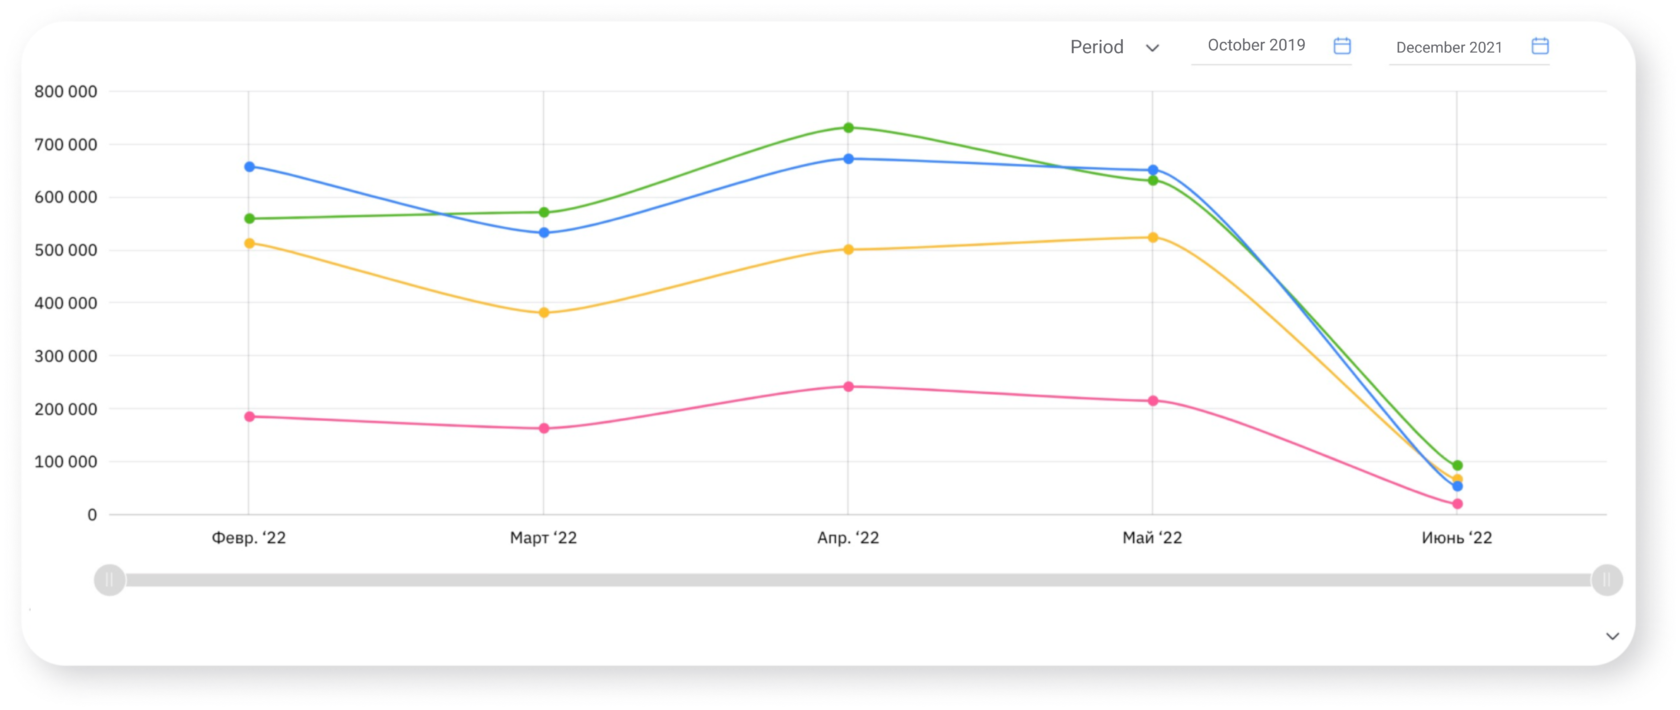

Trend analysis
Plan vs. Actual analysis


KPI indicators
CFD and projects
Visual reports for the manager
Analytics and visualization
Profitability control for legal entities, CFD and business lines


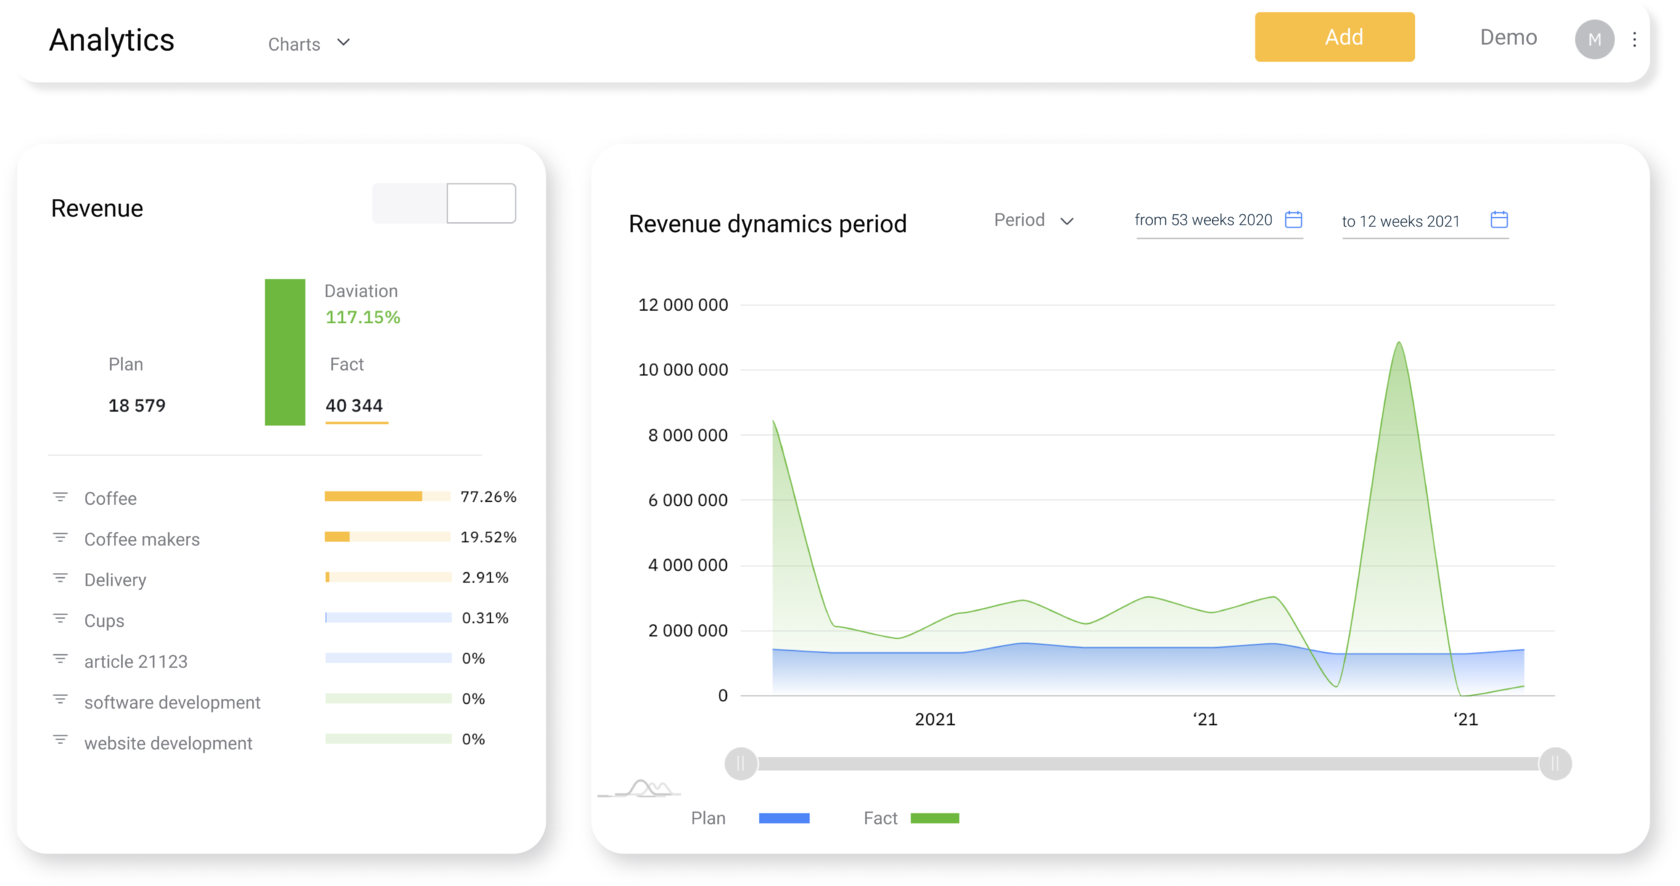


Budgeting and Plan vs. Actual analysis
Drill-down of the budget items
Profit and Loss Statement
Analytics and visualization
Cash gaps for each project


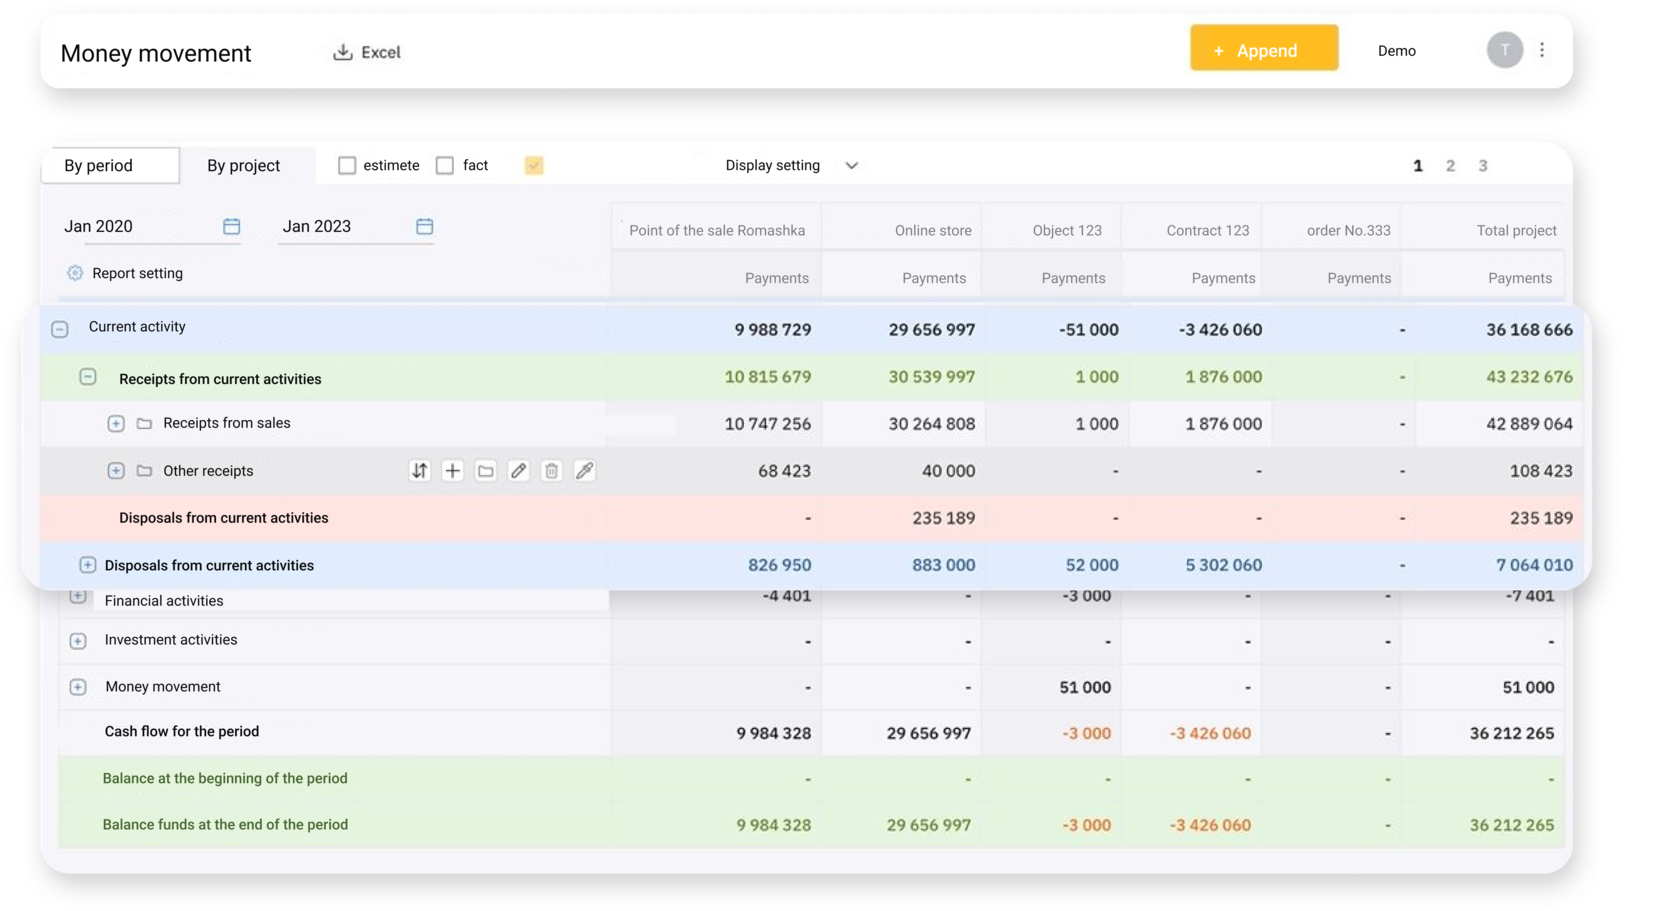
Cash flow statement settlement account for projects
Visualization of cash gaps on charts
Payment Calendar
Analytics and visualization
BI analytics
Dashboard is an indispensable tool for a Finance Manager.
A qualitatively compiled dashboard allows you to quickly find out what is happening in business — keep track of the efficiency of the new sales plan, the results of the change of price and the company's revenue.
A qualitatively compiled dashboard allows you to quickly find out what is happening in business — keep track of the efficiency of the new sales plan, the results of the change of price and the company's revenue.
Sales funnel


Cash flow
Financial KPIs
The service sends a daily cash flow report.
By receiving daily reports, you will be aware of the company's operational activities.
By receiving daily reports, you will be aware of the company's operational activities.
Allows you to quickly understand which customers have stopped making purchases.
This will help you increase the efficiency of working with the customer base and increases the LTV of customers.
This will help you increase the efficiency of working with the customer base and increases the LTV of customers.
Allows you to analyze sales by items, customers or projects.
By comparing sales volume, margin and margin, you will be able to efficiently manage pricing.
By comparing sales volume, margin and margin, you will be able to efficiently manage pricing.
Auxiliary reports
Daily reports for Manager
Lost Customers Report
Sales Report


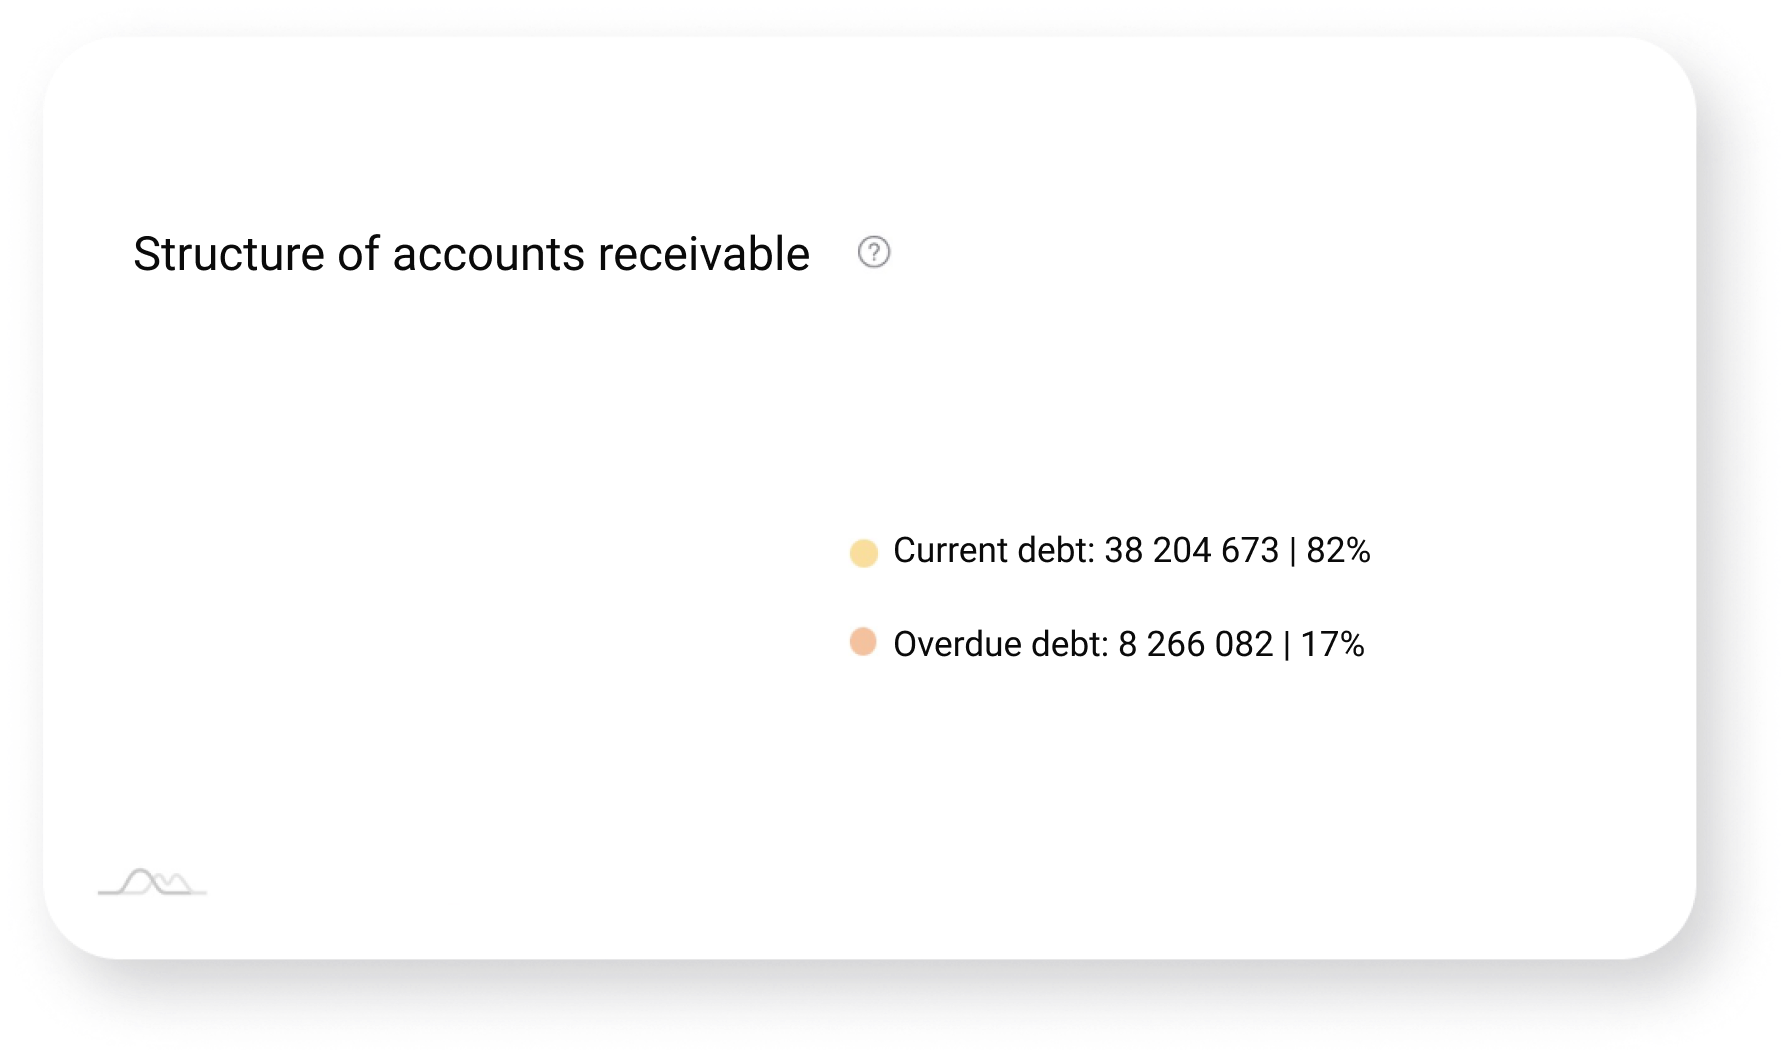
Answers the question: to whom do we owe and who owes us
Control of the overdue debts



46 470 755


Analysis of accounts receivable
and accounts payable
and accounts payable
Analytics and visualization
Allows you to stay in the budget for items and projects and prevent overspending


Approval templates and payment statuses
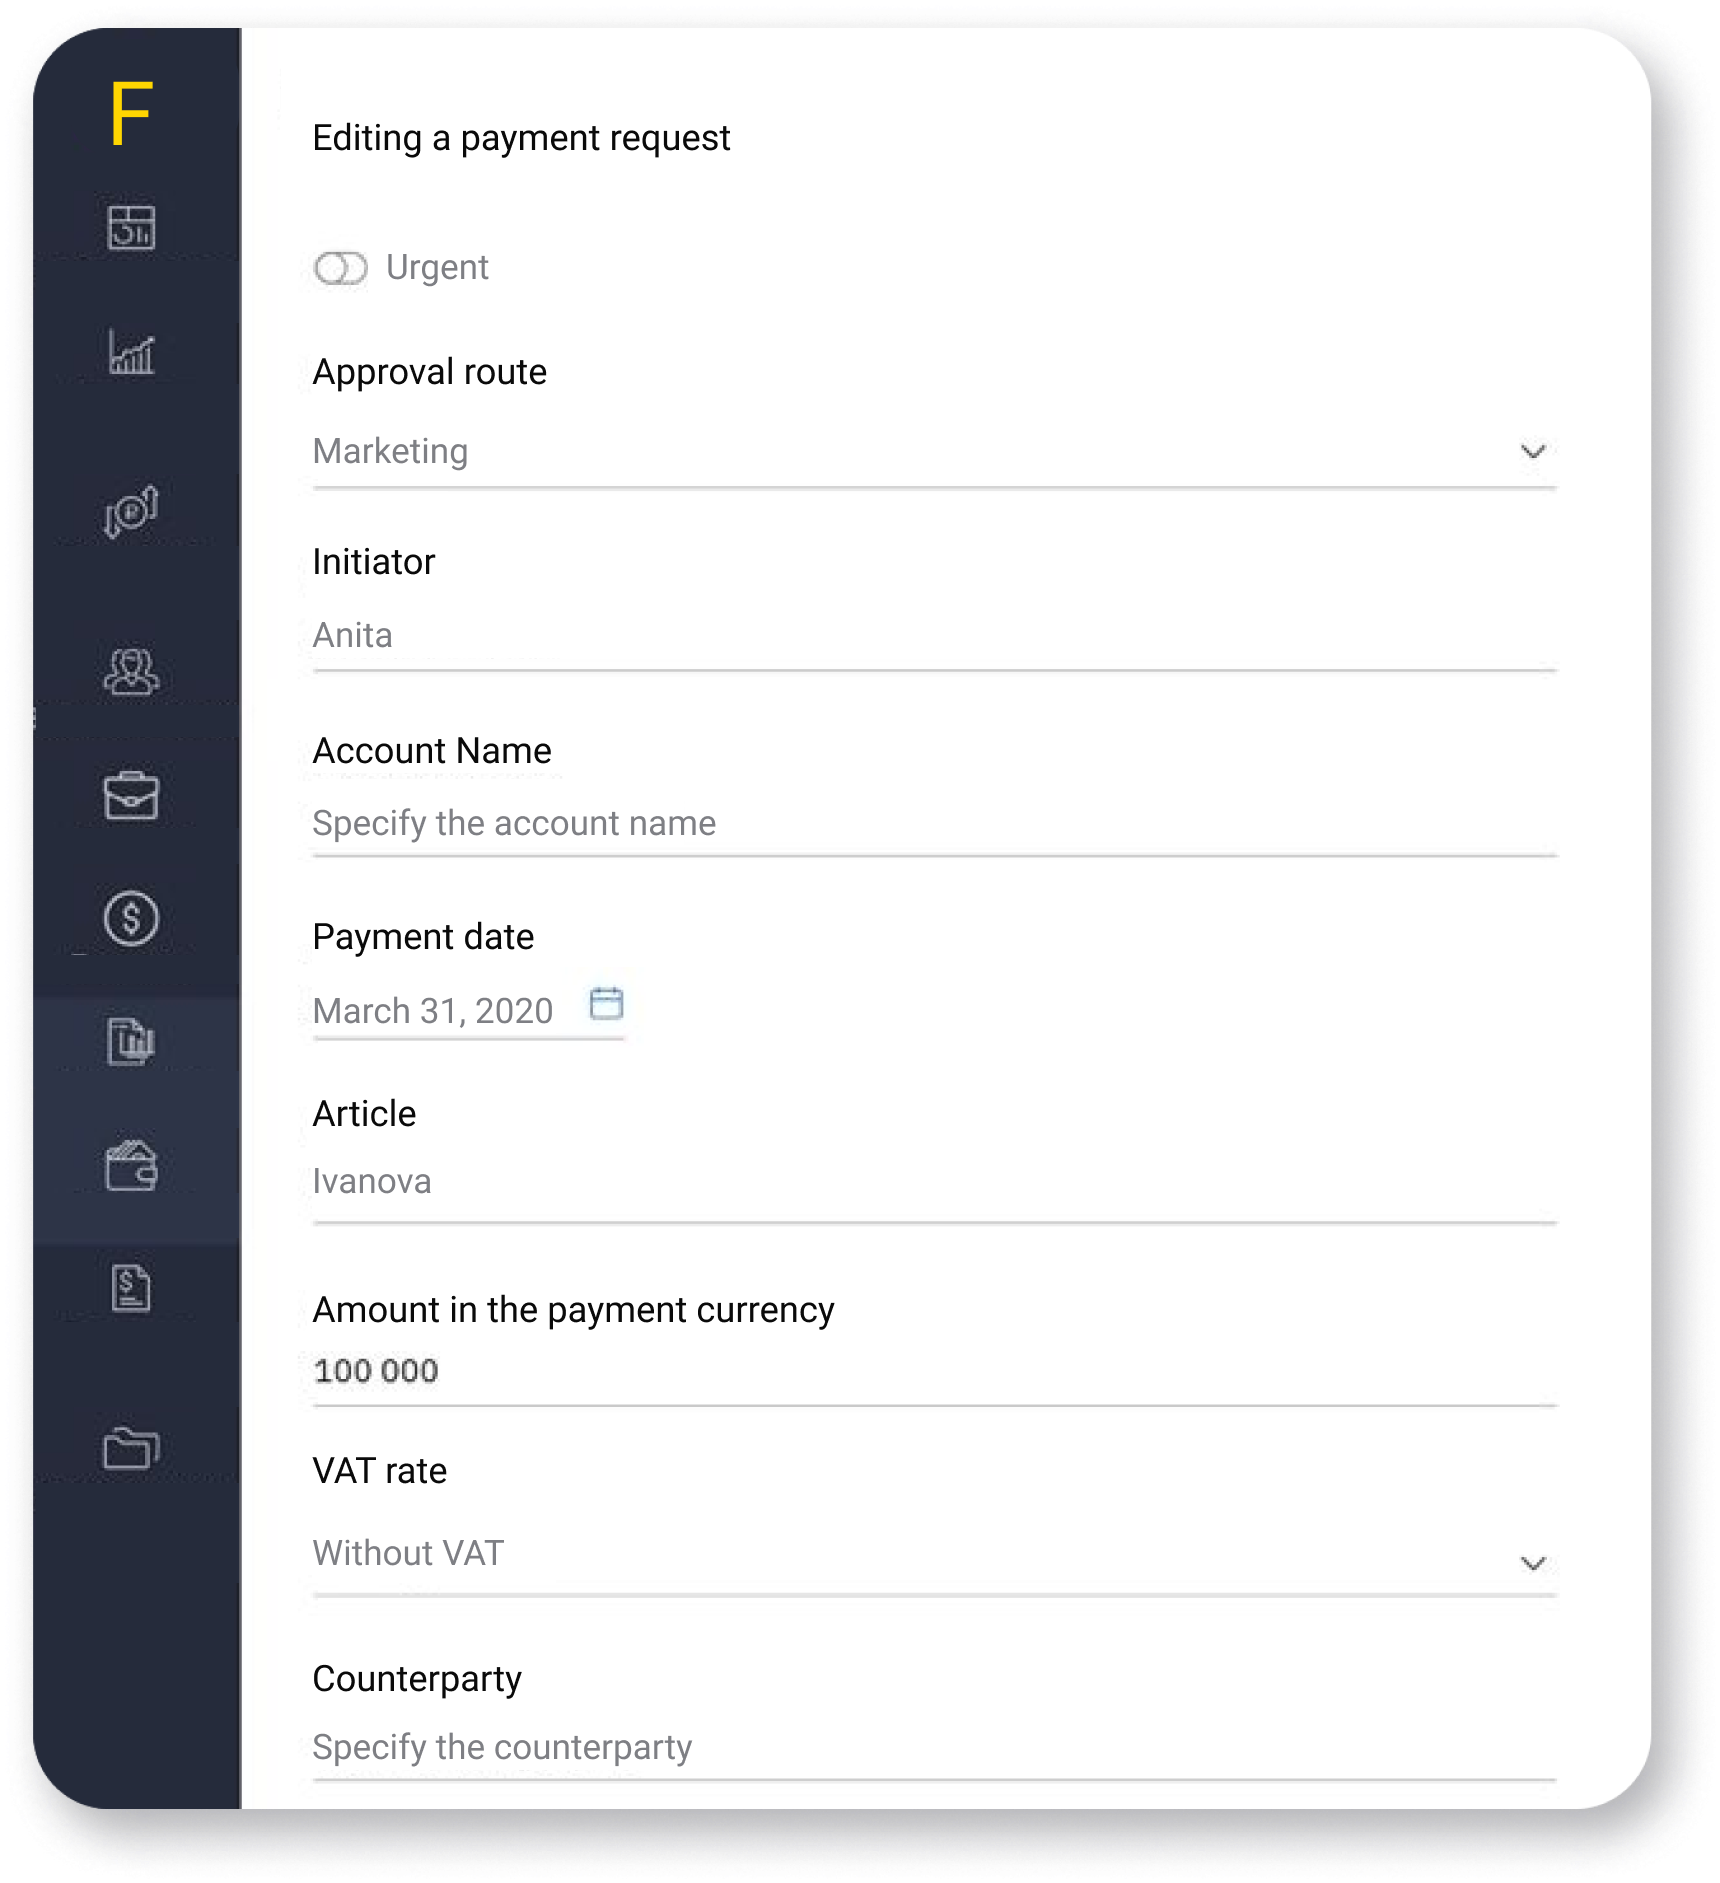

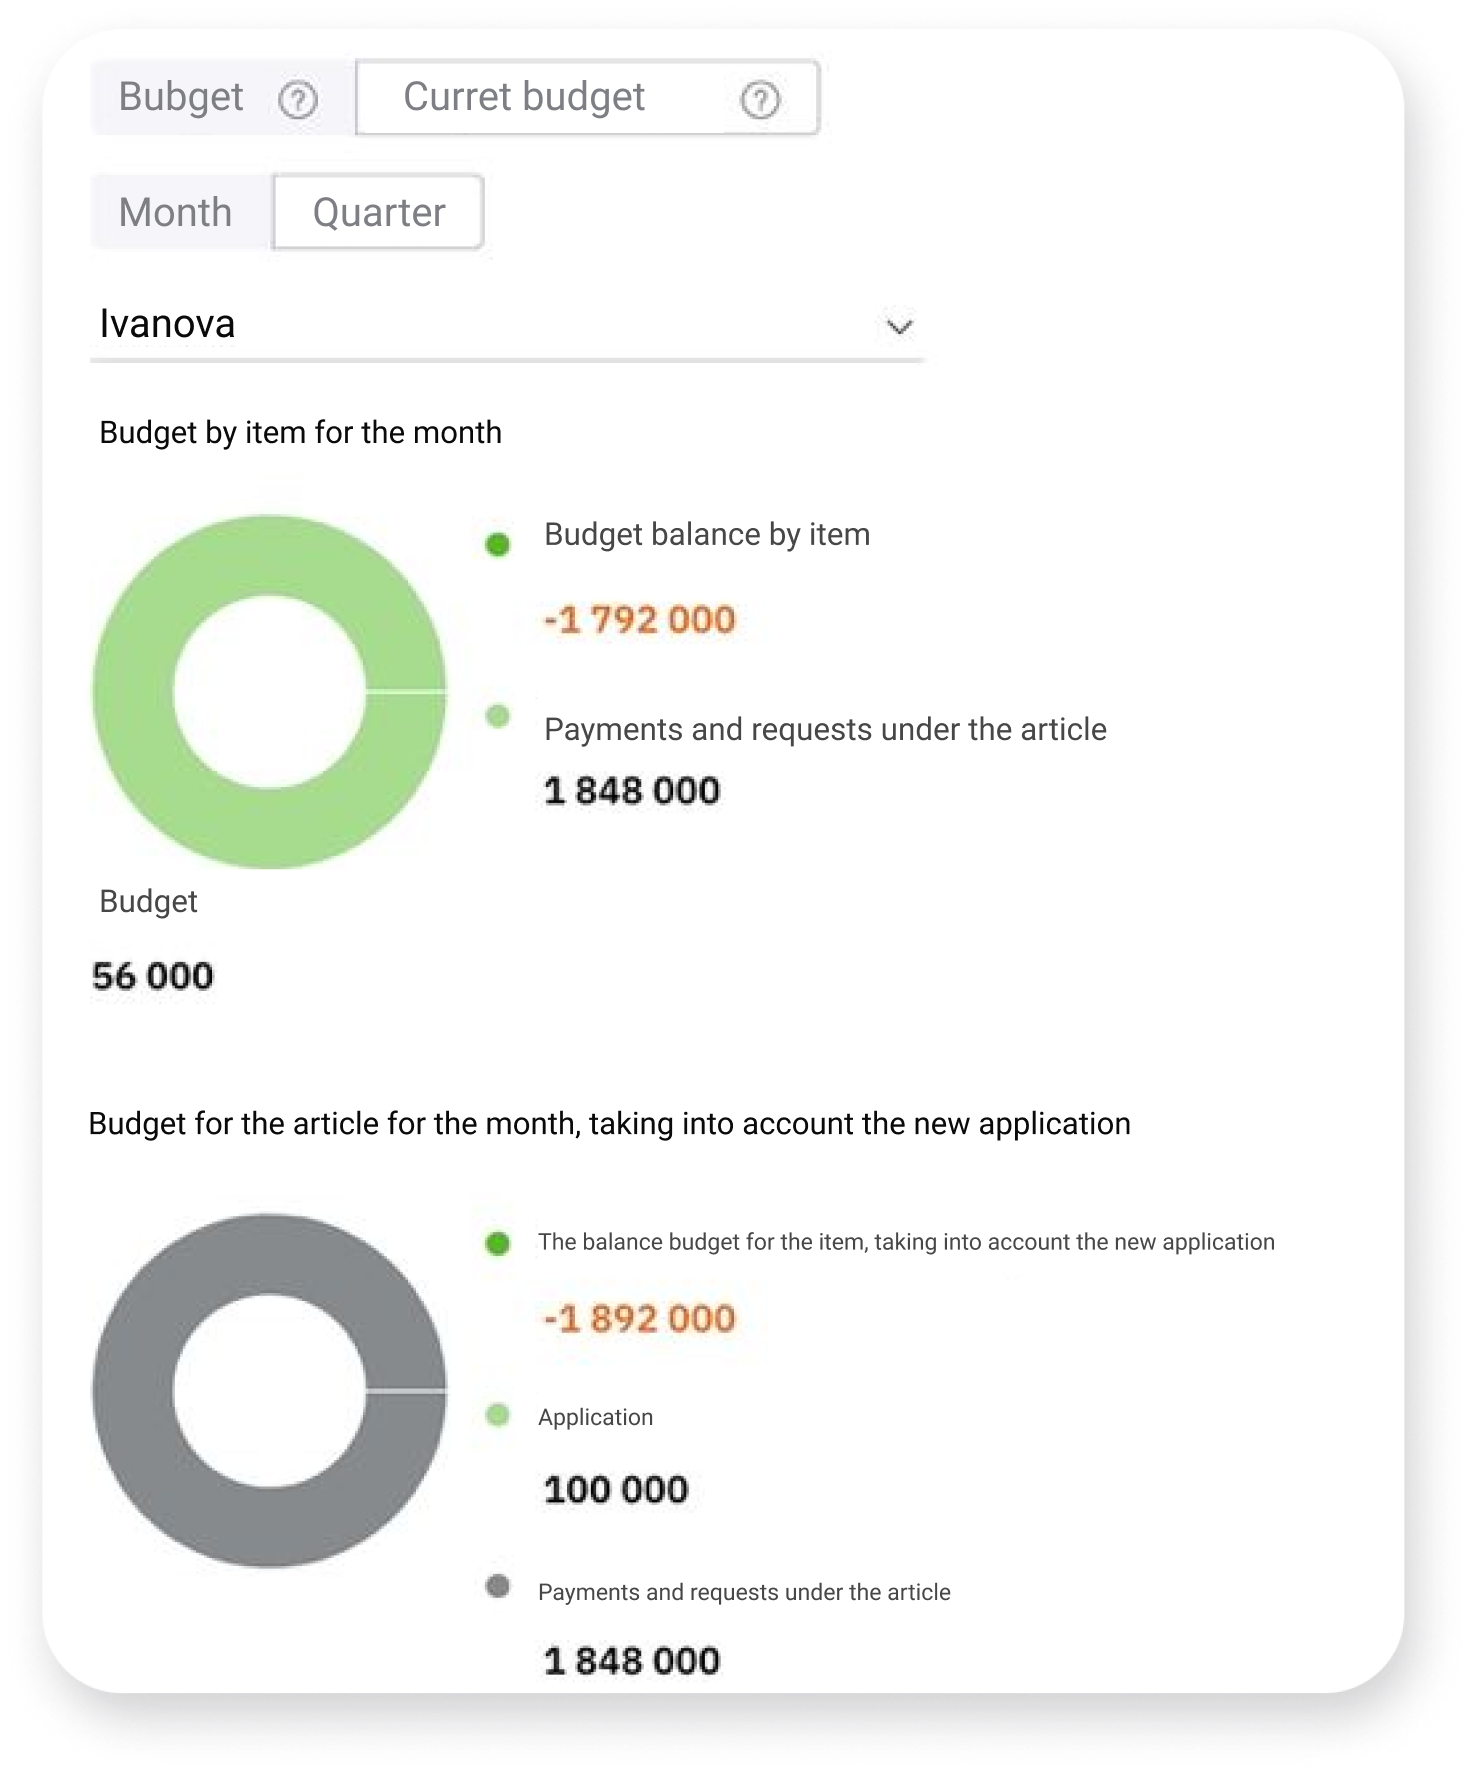

Payments Approval
Treasury
Estimations
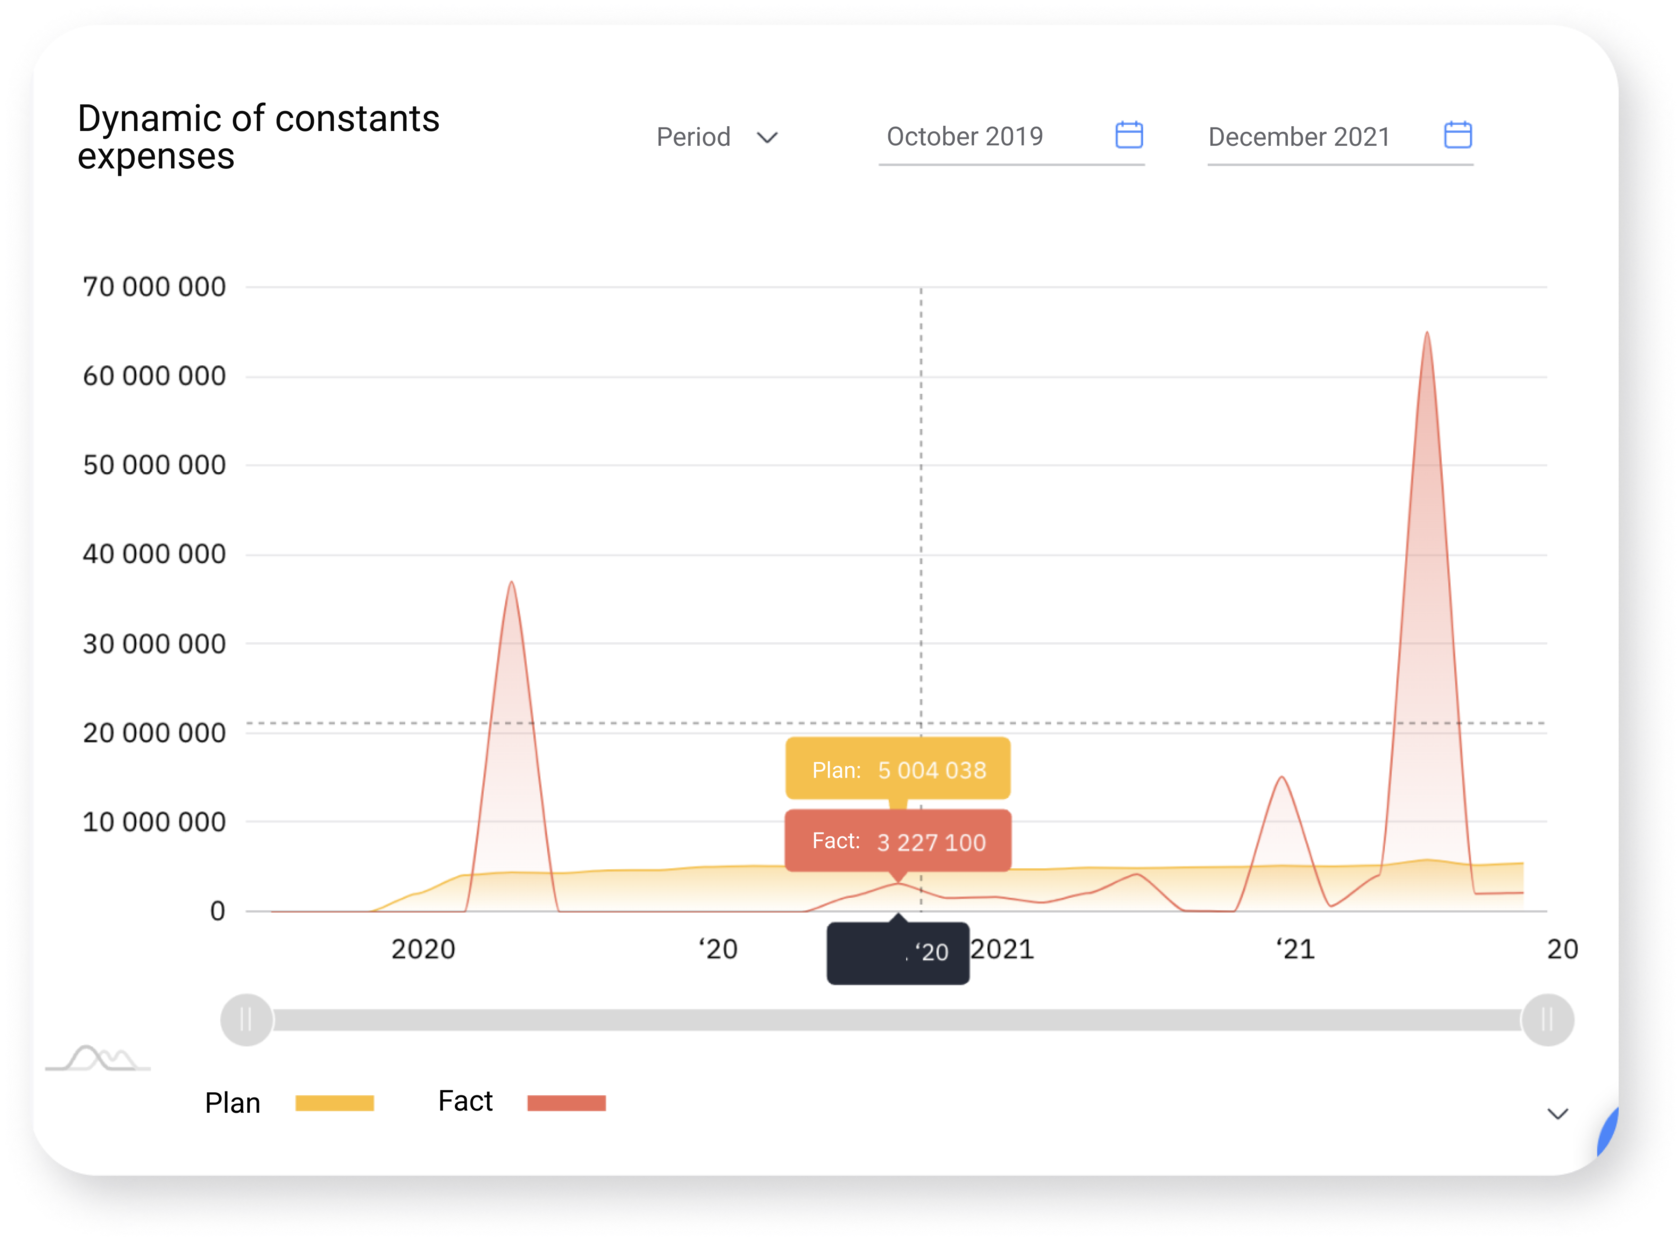
Plan vs. Actual analysis
Cash Flow by projects
Project profitability
Distribution by project
Plan vs. Actual analysis
Cash Flow by projects
Project profitability
Distribution by project


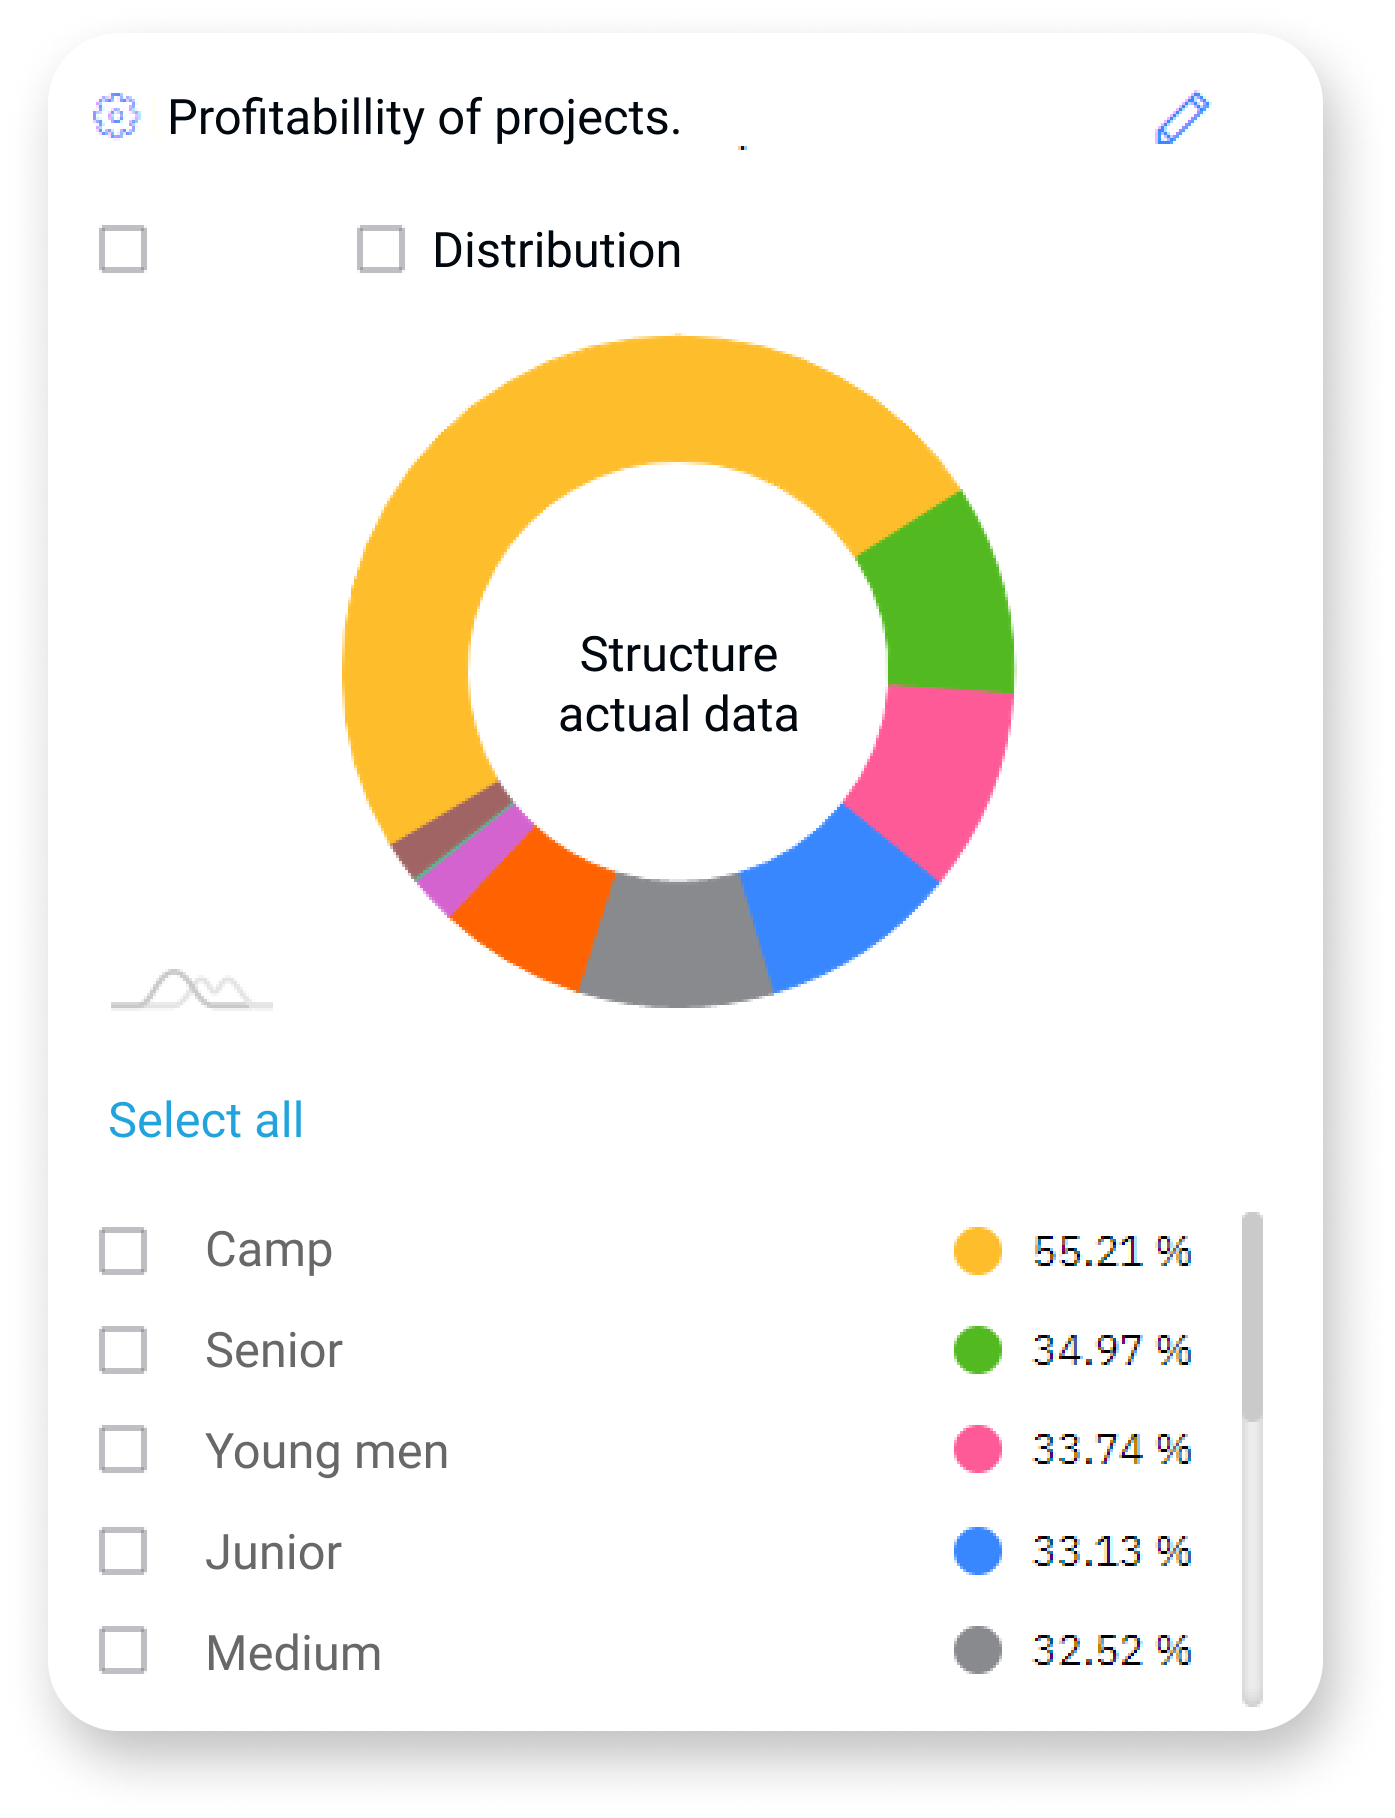
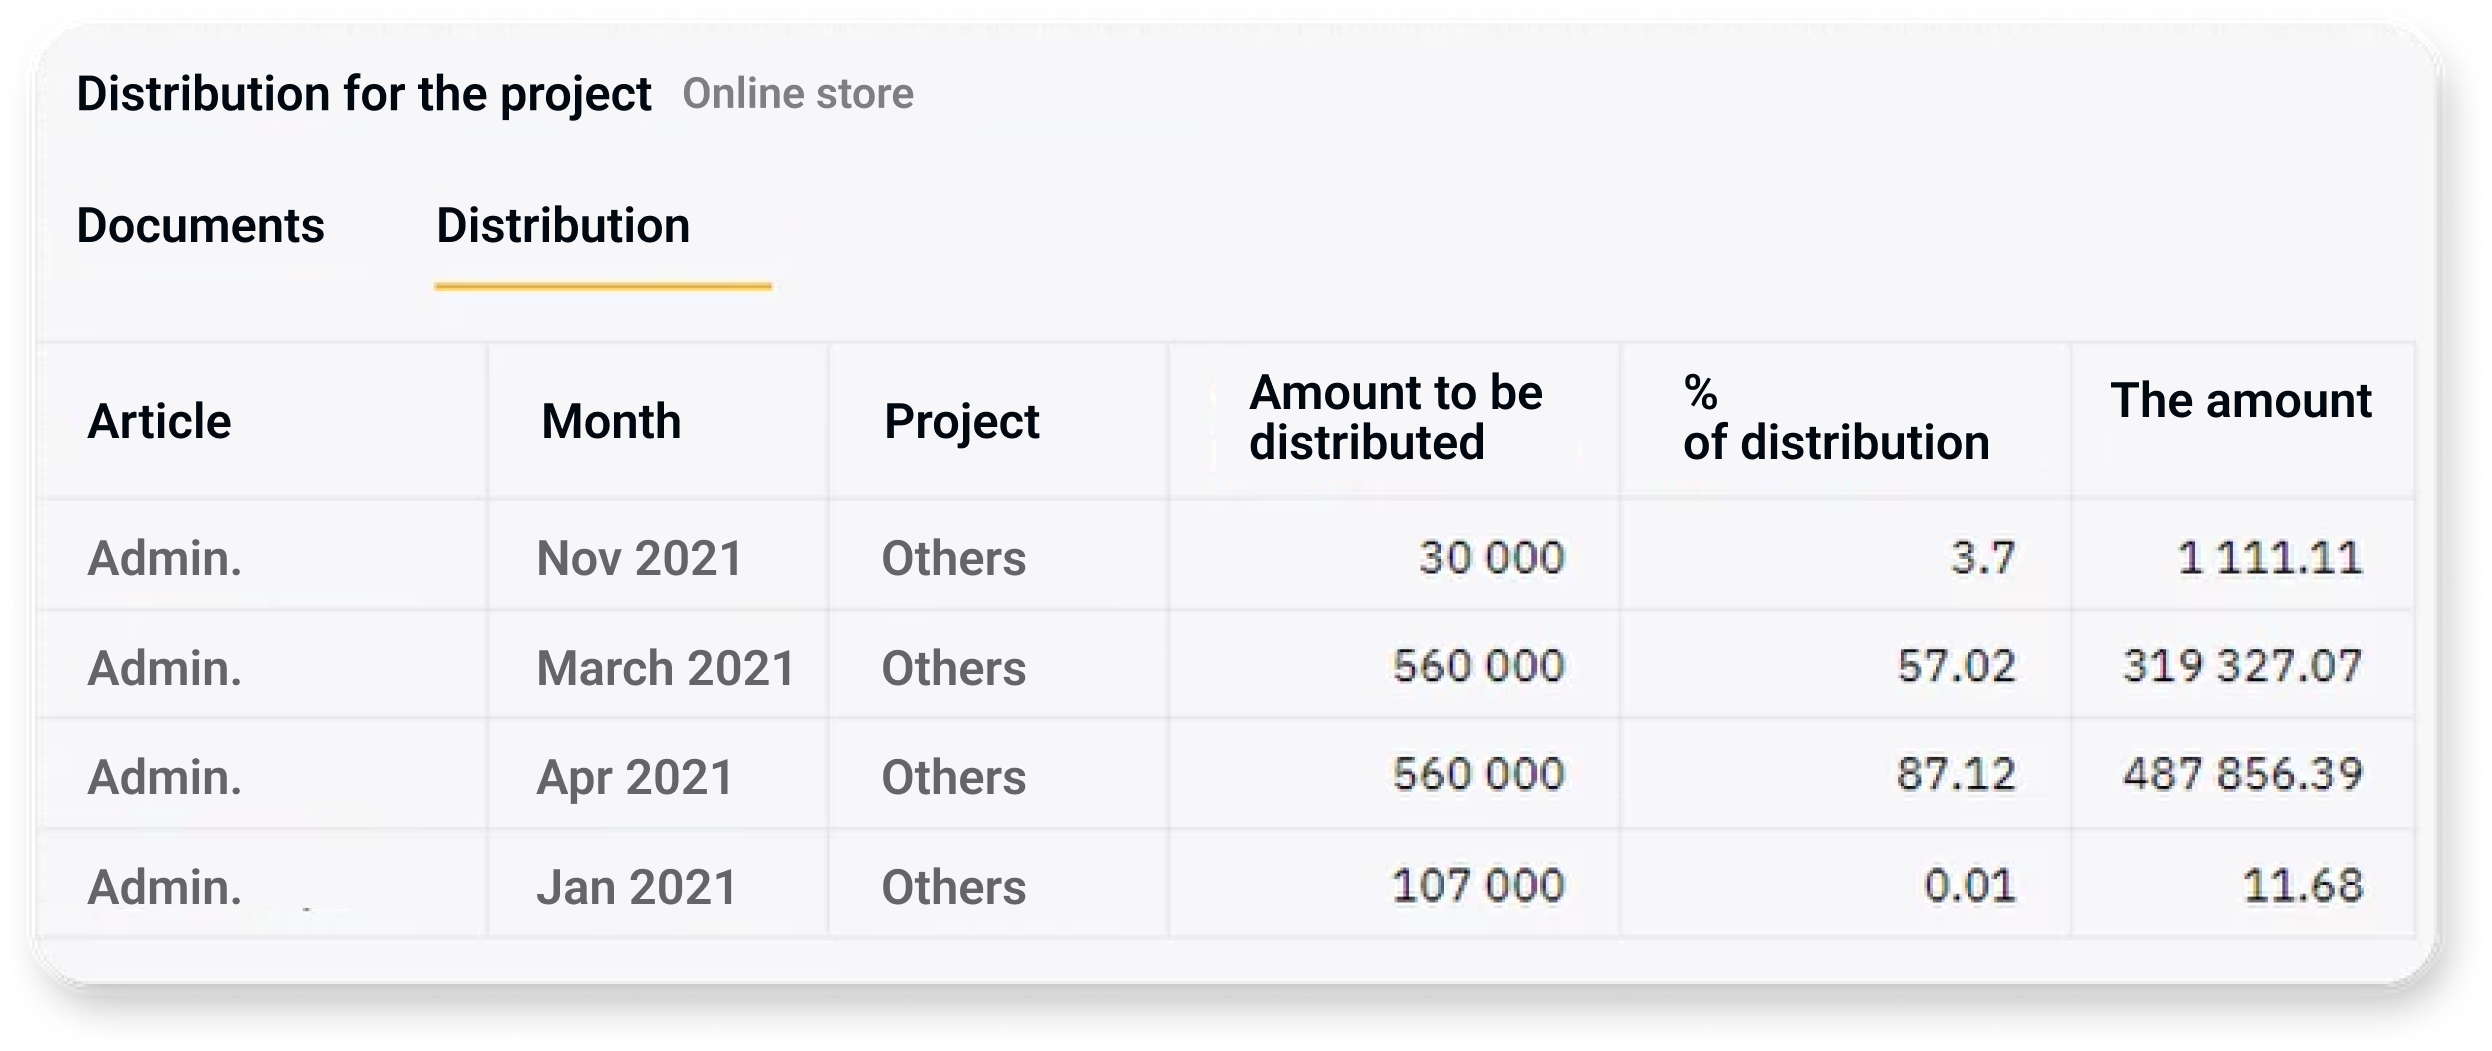
Project accounting
Estimations and projects
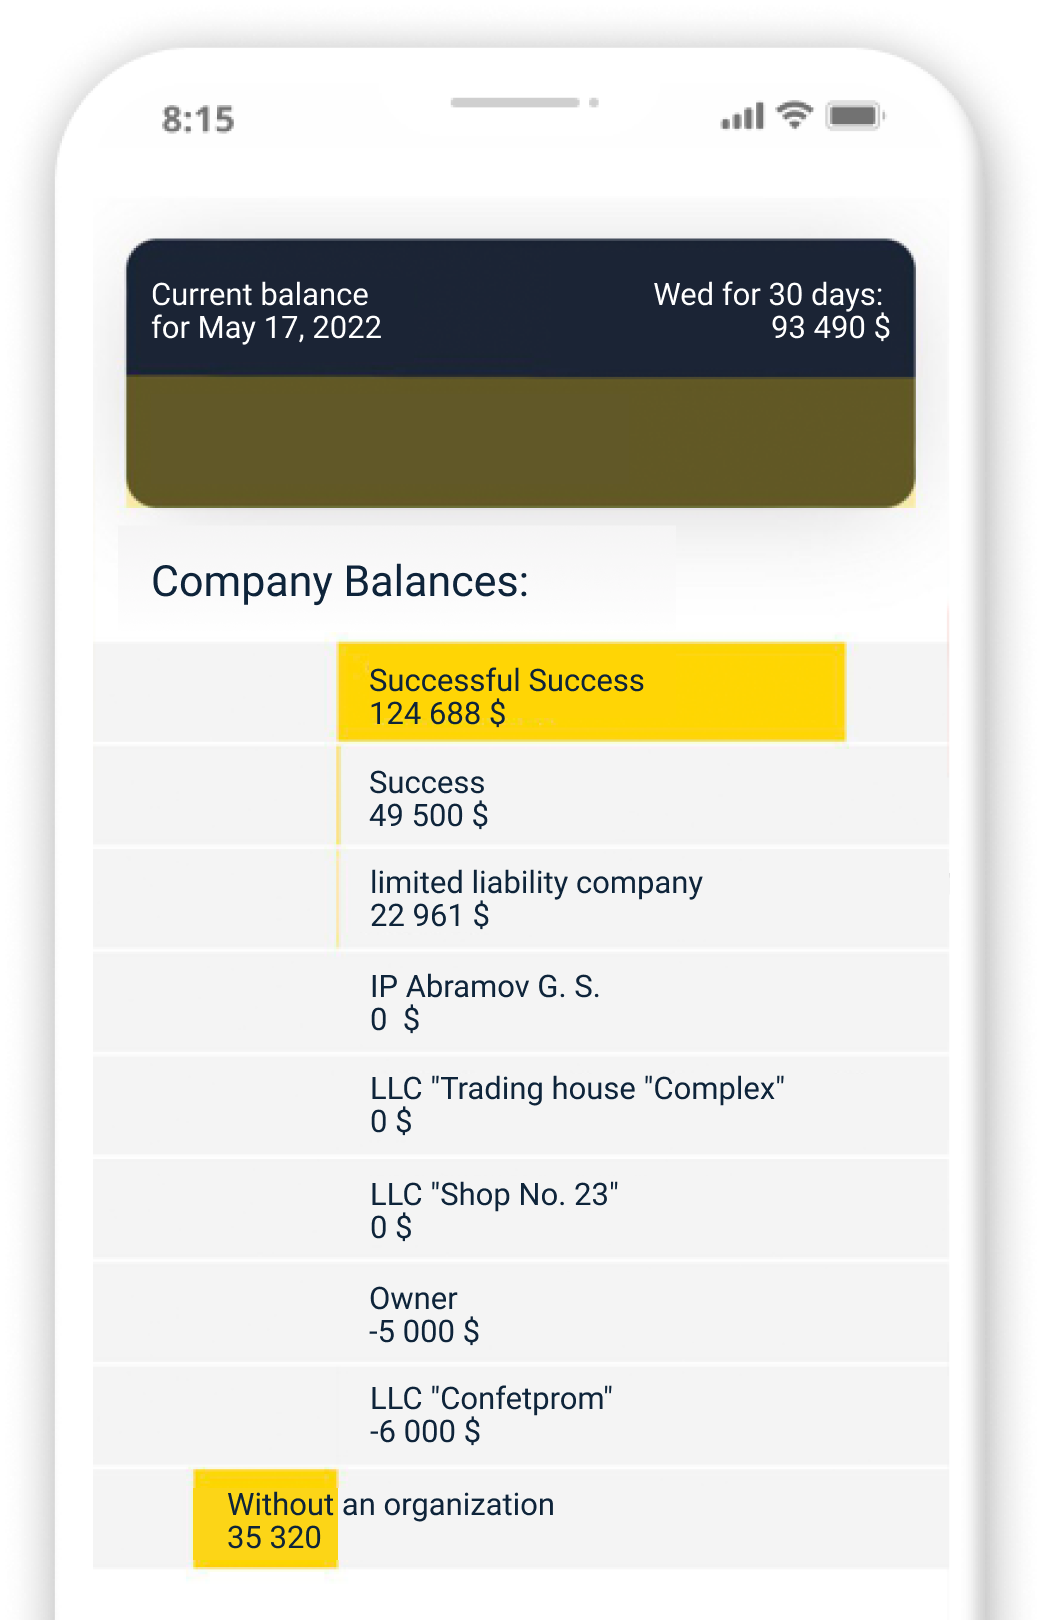
Mobile Application
Payments approval
Dynamics of income and expenses
Account balances
Account balances


Payment control

Try It For Free
Let us show you a free personalized demo and get a 14-day free access to it
By clicking the "Submit a request" button, I consent to the processing of personal data.
Control income and expenses.
Manage the profitability of projects, find growth points and earn more
Manage the profitability of projects, find growth points and earn more
Try 7 days for free


